Open link in next tab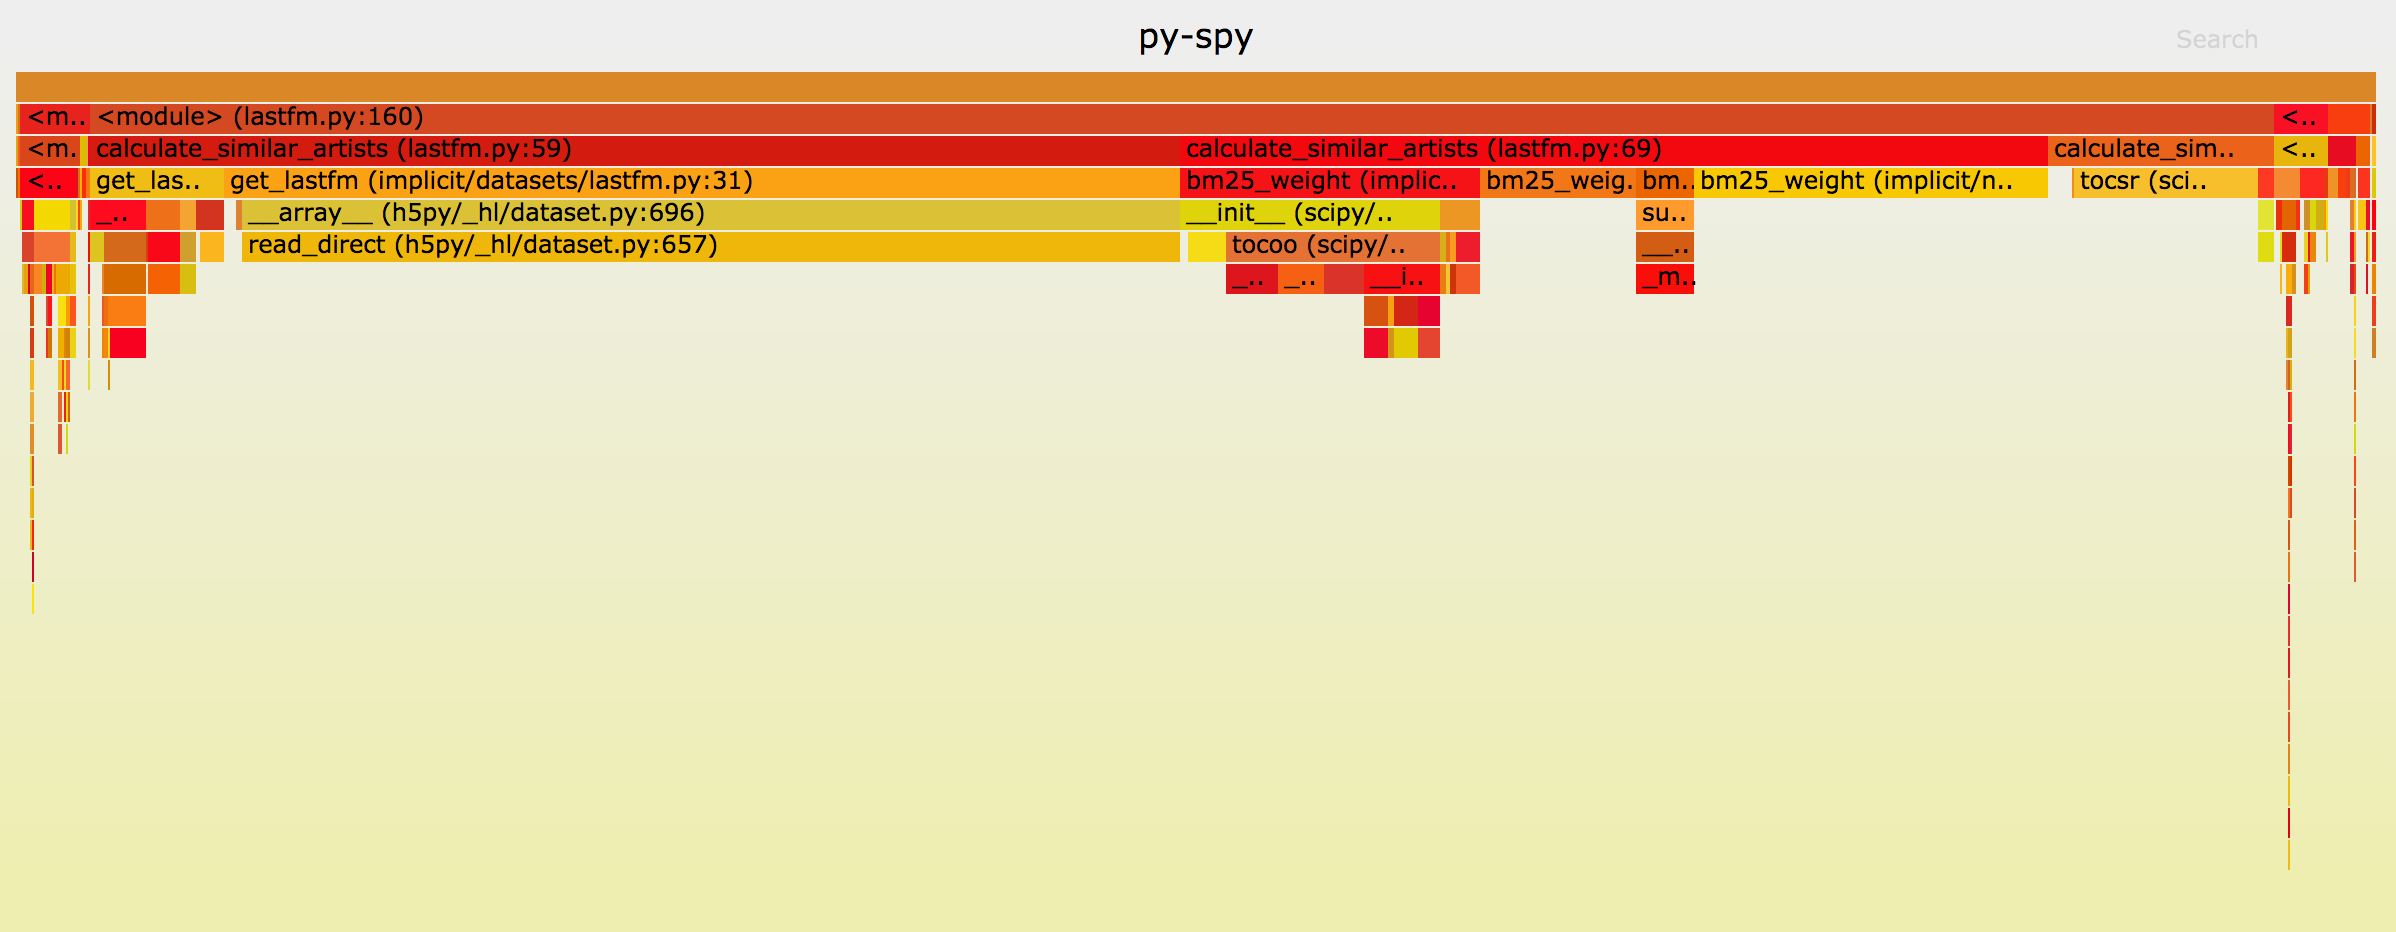
GitHub - benfred/py-spy: Sampling profiler for Python programs
https://github.com/benfred/py-spy
Sampling profiler for Python programs. Contribute to benfred/py-spy development by creating an account on GitHub.
https://github.com/benfred/py-spy
Sampling profiler for Python programs. Contribute to benfred/py-spy development by creating an account on GitHub.
Well, with py-spy I can attach to any Python process and see which line in the source code is using the most time. I can see this updated in real-time. All this is easily done without giving any thought to profiling while writing the code.
Surely the same cannot be said of C. For example, how would I see which line of ls is taking the most time? I'm guessing it will take more than the two lines it took to setup and use py-spy (brew install py-spy, py-spy top pid).