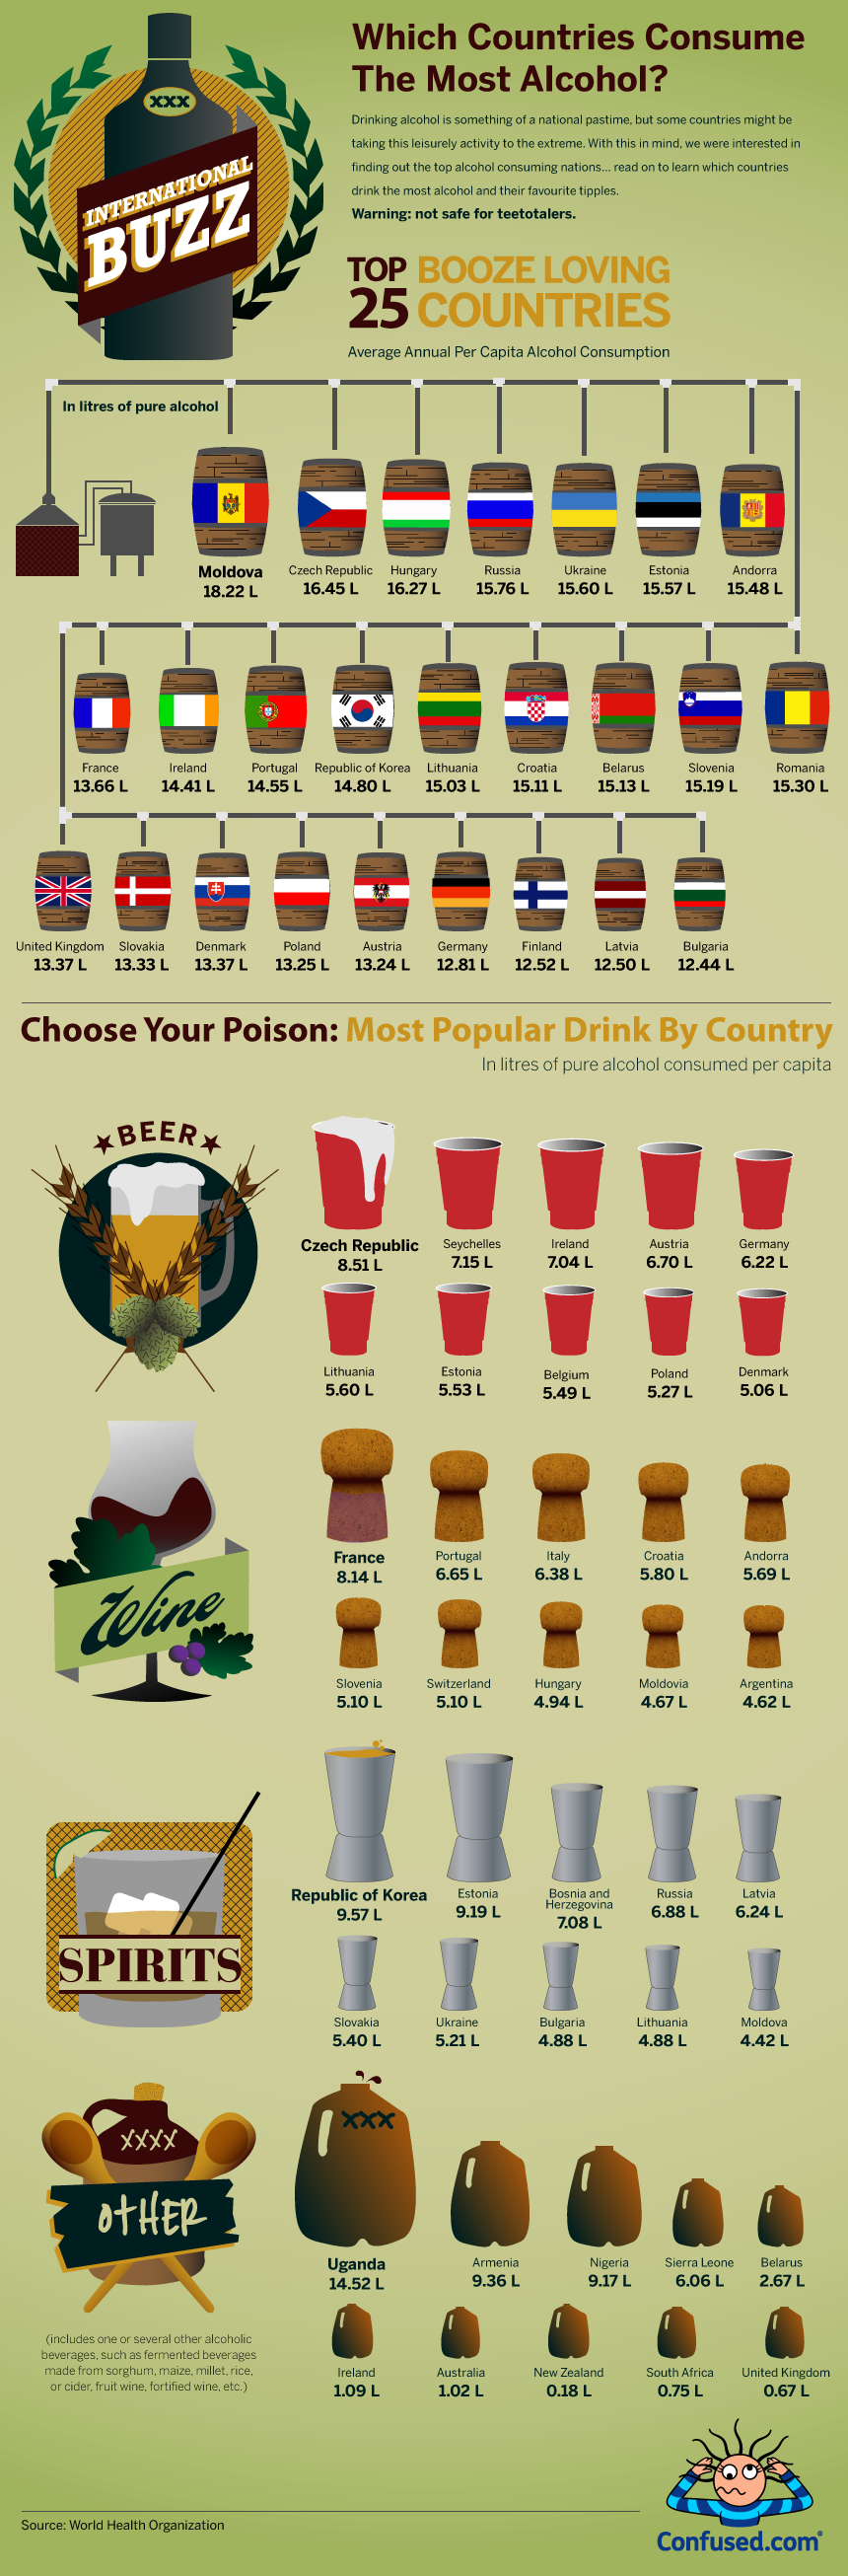
Maybe these alcohols aren't pure alcohols in of itself, just the drink overall.
EDIT: It's pure alcohol. This stat is wack.
Both charts are in L of pure alcohol. I feel like they are not the "top counties" but just a random selection. And the selection is different for both charts.
TLDR chart bad
I don't even drink alcohol but it is an affront to Germany that the beer in this image is depicted with fucking plastic cups instead of beer mugs.
Ah yes. The germans always need something to complain. This info graphic doesn't force you to drink your beer from red cups.
Nur Nörgler und Meckerer hier.
I find it really weird cider is grouped in with other. Speaking of other. Why is NZ in such a weird placement?
Also I know the Aussie drink pre mixed shit, does that just come under spirits?
I have read here on lemmy that "being sober is a super power" and I do want to be a super hero too.
So take care people, IWDWYT !stopdrinking@lemmy.world
As an American I think it's probably best that we stay off the top of this list. Way, way off.
I'm thinking Denmark gets a bit of a boost in these numbers from Swedes going across the border to buy cheaper alcohol. It's legal to do, but they fine a lot of Swedes for overloaded cars and trailers coming back.
I doubt many Swedes living close to Denmark even knows where their local monopoly is. Just kidding, all Swedes can sense where the Systembolag is.
Il n'y a pas un problème entre les statistiques du haut et celles du bas? (Cf l'Ouganda). J'ai été voir sur les commentaires du post Reddit original mais n'ai pas trouvé de réponse pertinente. Les mêmes questions cependant
Le haut calcule en litres d'alcool pur, le bas en litres de boisson. Il faut plus de litres de bière que de litres de spiritueux pour avoir un litre d'alcool pur. J'imagine qu'en Ouganda on boit beaucoup d'une boisson peu alcoolisée.
Édit : c'est faux, je devrais pas poster pas réveillé 😅