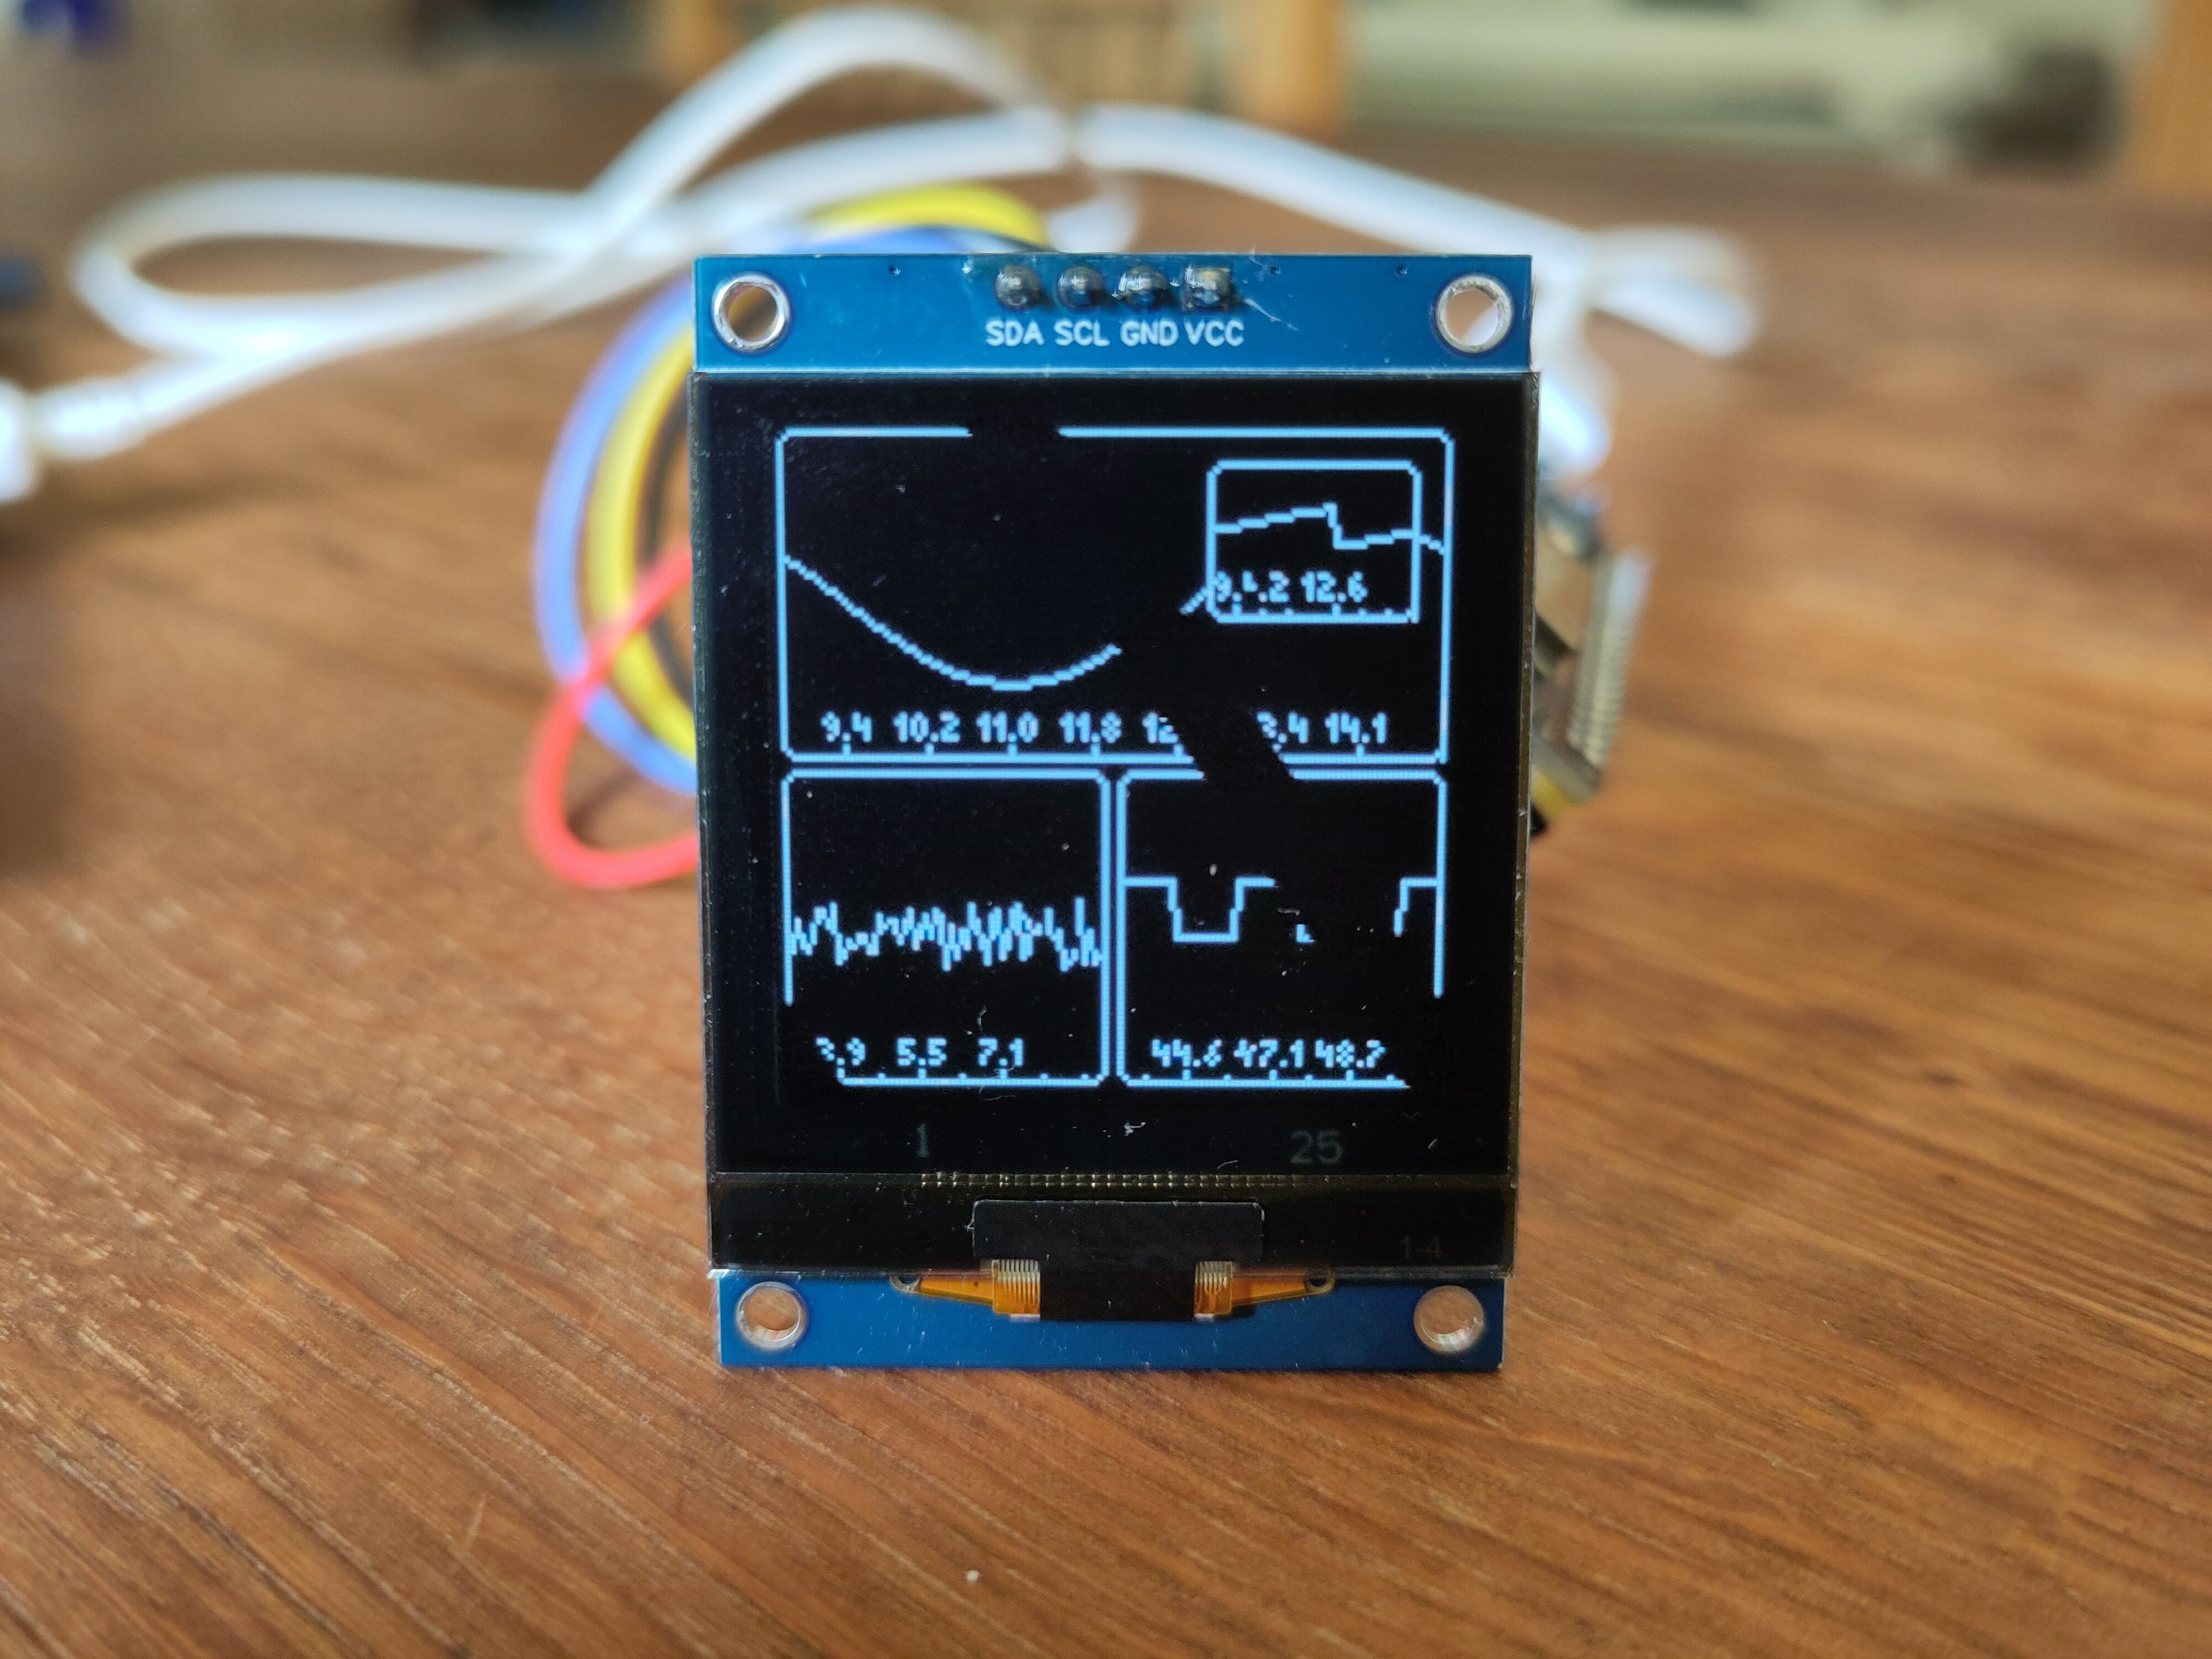
I'm writing a little plotting library for LCDs. I'll try to publish it once it's more polished. What do you think?
For now it supports reading data from a Vector, arbitrary scaling on both axes, linear interpolation, different point styles (square, circle), arbitrary many graphs.

I'm not sure if it would be helpful for your project, but you might be interested in the concept of the grammar of graphics (https://towardsdatascience.com/a-comprehensive-guide-to-the-grammar-of-graphics-for-effective-visualization-of-multi-dimensional-1f92b4ed4149).
I use a version of this in R as implemented in ggplot2. What is nice about it is that you can use standard text descriptions to build an arbitrary graph.
It's a pretty interesting concept. I don't want it here though. I'm just building this for my own needs (mostly fun).
I'll look into this as a consumer though next time I need to plot stuff on a desktop :)
Not yet. I'll reply here once it's published. It will be pretty crappy C++ since I don't care too much about learning it properly. I'm just shaving yaks right now.
I would love one of these with a graph over a period of weeks visible on the screen that gives me soil readings from my houseplant.
Yes, great idea! I love having lil devices around that I can simply look at instead of needing to use my phone or a laptop.
Omg that's so fucking cuuuuuuuttttteeeeeee
It would go perfect on a costume for like a fake techno watch. There's probably real uses that's just my first thought though.
Thanks a lot. I mostly did it because I love the looks of it too (and because I've always wanted to build some kind of GUI library). I was also considering using it for something artsy. I like the idea of a watch!