Right denial
First what is that graphic supposed to mean? It doesn't says anything about Argentina? You just put a chart without any source or explanation and expect people to understand what is supposed to represent?
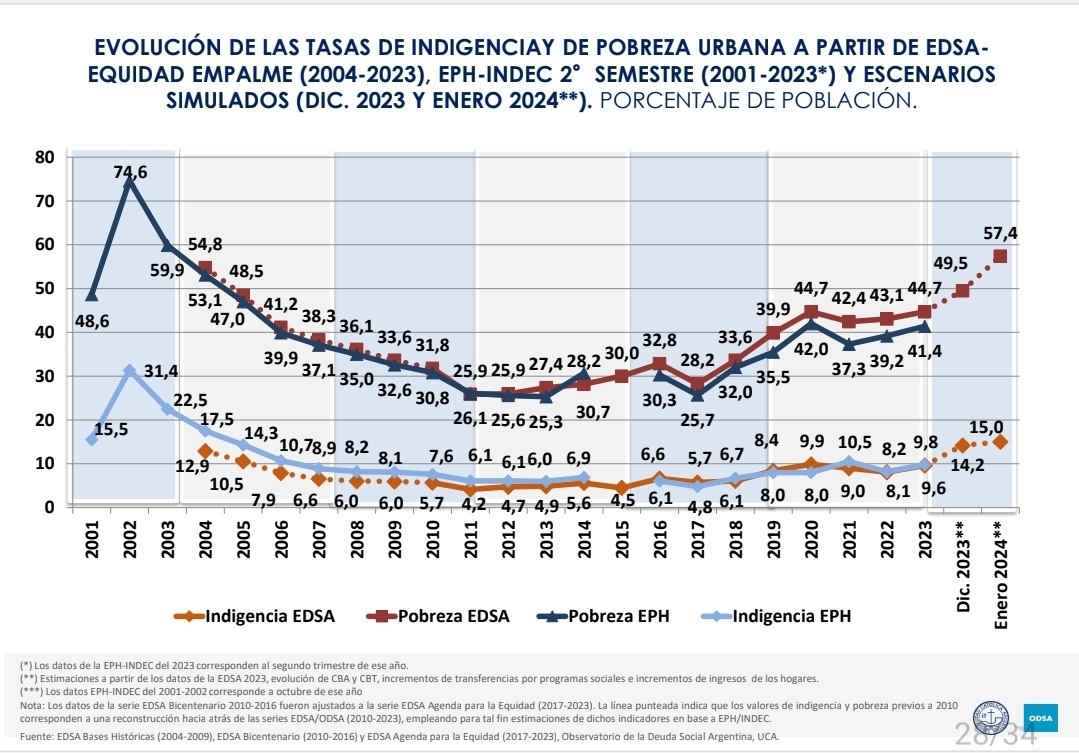
And then accused me of denial. that's rich. Specially coming from someone posting inaccurate information about an inaccurate estimate (the simulation you refer was done by the ODSA and calculated for, it was 57% POVERTY ESTIMATE not 60% and only contemplated data until January 2024) as if it were true facts. Here. Allow me to share the simulation that was made:
 Here is the source:
https://wadmin.uca.edu.ar/public/ckeditor/Observatorio%20Deuda%20Social/Presentaciones/2024/Observatorio-Pobreza-Informe-serie-historica-2004-2023.pdf?utm_source=emBlue&utm_medium=email&utm_campaign=Observatorio%20-%20ODSA&utm_content=Observatorio%20-%20Primer%20envio%20febrero--Argentina%20(2004-2023):%20un%20r%C3%A9gimen%20inflacionario%20cr%C3%B3nico%20de%20empobrecimiento%20y%20mayor%20asistencia%20social&utm_term=multiple--7--none--70-80--ENVIO%20SIMPLE
You want to see the actual April measurements done using actual real data instead of spouting more lies?
Sure go ahead. Do notice the April 2024 latest measurements say 48.9 instead of 60%. So poverty it is going down instead of up

Source: https://www.perfil.com/noticias/economia/la-pobreza-trepo-a-casi-el-49-segun-un-estudio-de-la-universidad-di-tella.phtml
Then you lie some more about inflation saying it's going up, while even the opposition here recognized it is going down
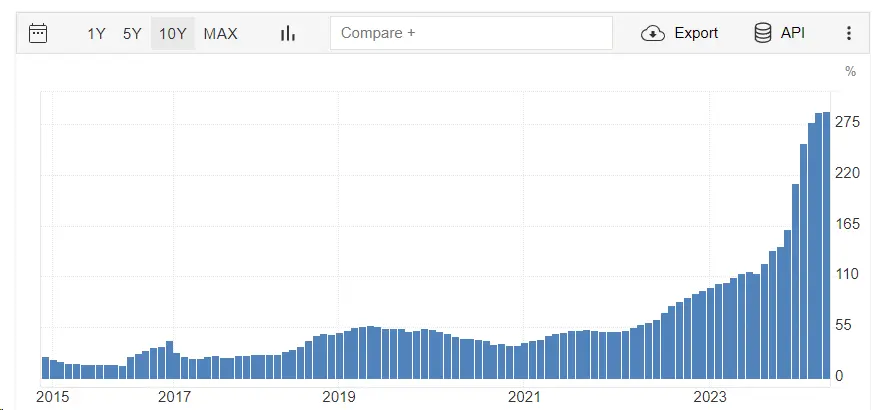
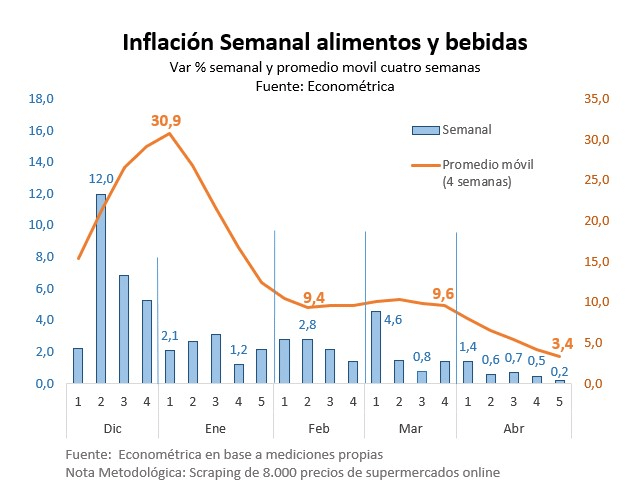
Here, have some more data for the weekly inflation we have, this comes from the one consulting firm that's been measuring the same as the official government data and do notice the down trend:
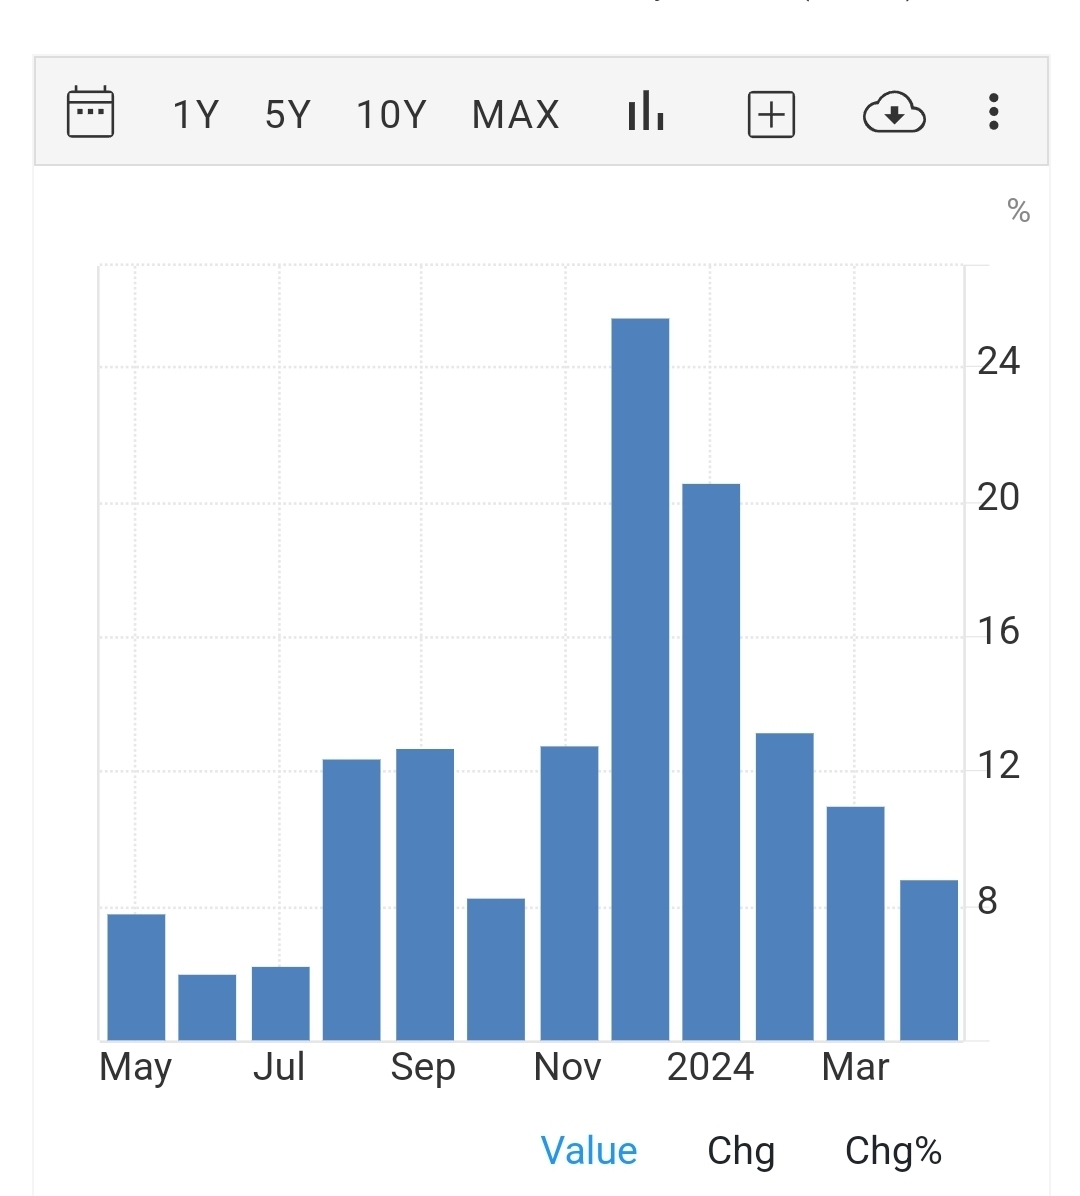
You want to see the monthly inflation? Oh what's that? it's going down instead of up? UH OH! LOOKS LIKE SOMEONE IS LYING HIS ASS OFF, and it surely isn't me!
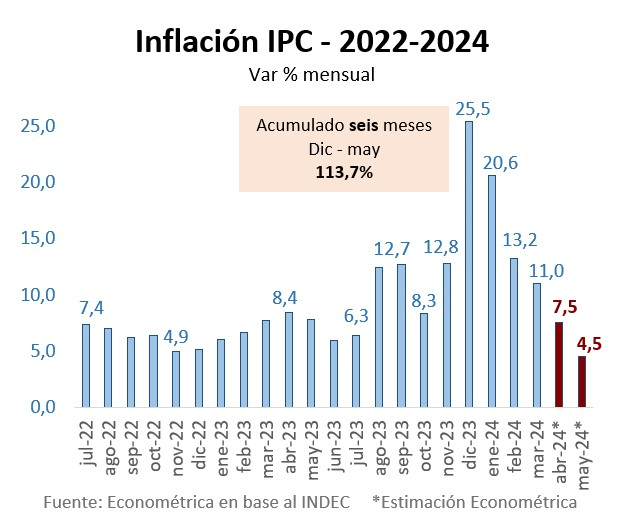
Sources:
https://www.indec.gob.ar/uploads/informesdeprensa/ipc_05_24F9890B1583.pdf
Then you start talking about economic activity, as if we weren't coming from a literal recession since the past year. Go have a look, we literally have been dropping economic activity since last 10 years. Why do you think people got sick of the leftist government?
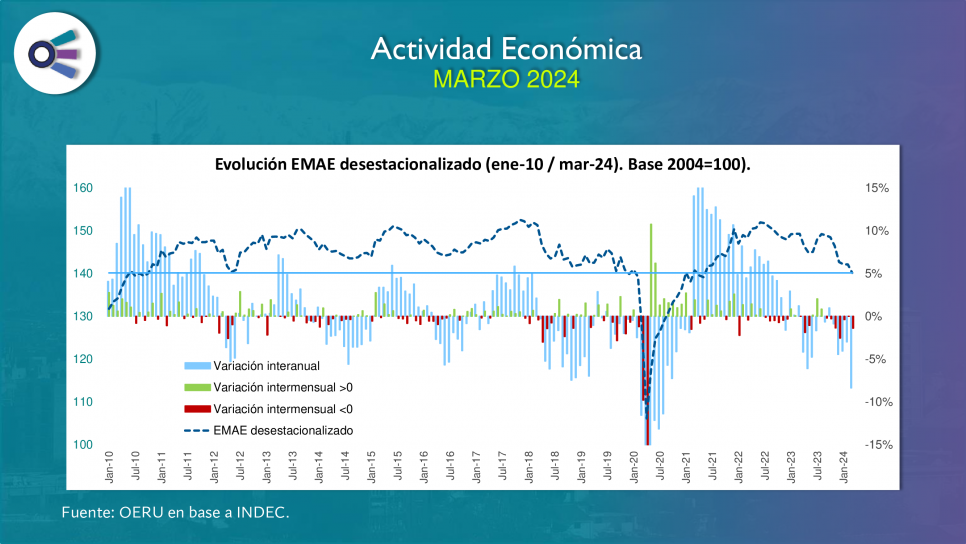
These charts are based all on indec Data. Sources:
https://fce.uncuyo.edu.ar/oeru/upload/1a1bc596e87c2e80e0f7890fc29310e5.pdf
Fortunately we do seem to have a glimmer of hope in that way, notice February line? We are not in the best shape, but we do seem to be picking up. Hard to tell as this activity chart here is not an official estimate, it comes from a consulting firm:
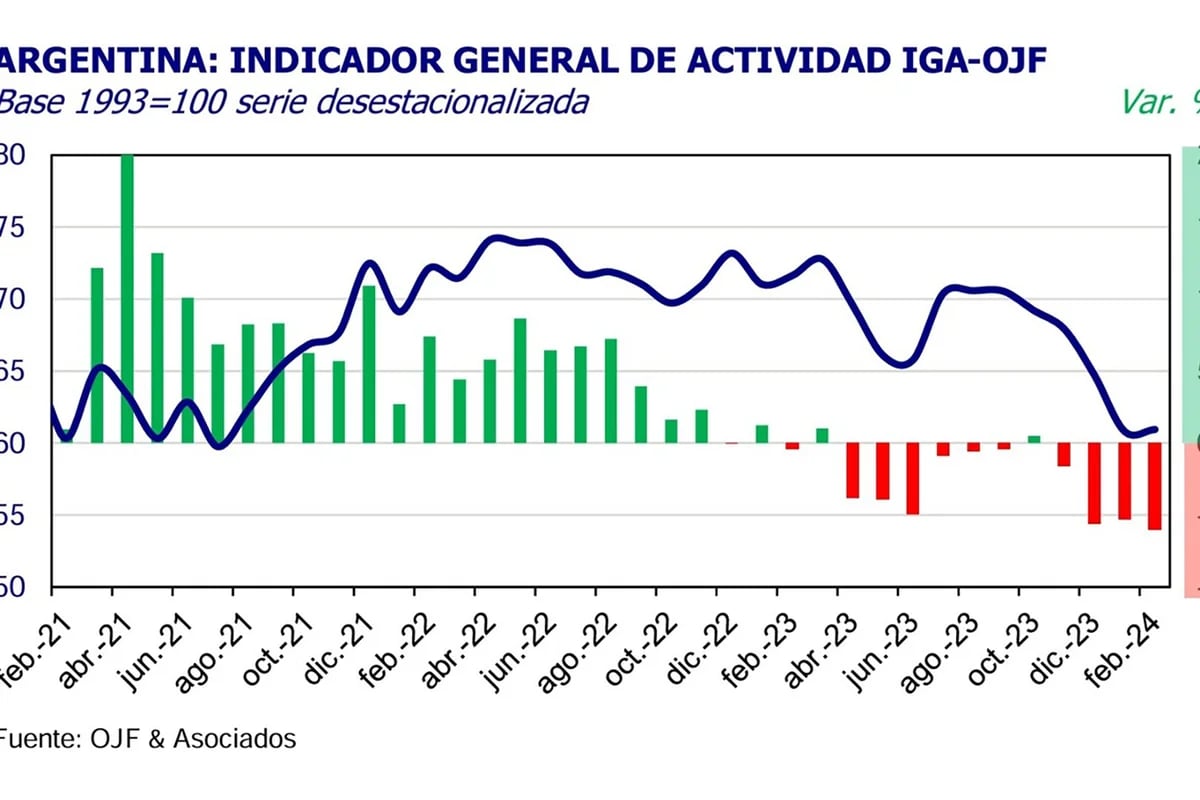
We do see things are getting better little by little. Whoever denies that is living a delusional life.
I will leave the sources because unlike you I am not an malignant uninformed web poser in search of internet points