Monte Carlo approach to looking at Bidens chances.
This is an approach I've been using since last November to put Biden's polling in a historical context. I'm using the Gallup approval rating dataset because its the longest, deepest single source dataset where the same question "Do you approve or disapprove of the way [current president's name] is handling his job as president?". Its been going on since the 40's, but has remained extremly predictive of the next president.
Previously, I presented some results (March) in the c/Politics community where using this approach, I said that Biden had between a 5-15% of winning the election. At that time, Biden was polling higher and there was more time between now (then) and election day.
I've re-run the simulation with updated numbers and am presenting them here.
First, get the mean and standard deviation of how approval ratings for past presidents have typically changed leading up to an election based a 30 day window around the current date. I then compare them to a 30 day window at election day, and get back a distribution of shifts: the typical range over which a presidents approval might change between now and the election

Next, I calculate a mean and standard deviation of approval ratings for incumbent Presidents who win their second term. We kind-of have to stick with incumbent presidents, based on the nature of the data. There really is no way to ask the Gallup pole question of non-sitting presidents or candidates.

Using these two distributions, I take a sample from the 'shift' distribution, and add it to Biden's current polling.

I then calculate the probability this new polling value would have come from the "Incumbent presidents who won election" distribution, effectively giving us the probablity, that based on extant polling, Biden can get into an approval range not-disimilar to Presidents who won re-election. Based on this approach, I'm getting an average probability of Biden winning the election at around half a percent. This is down substantially from March, where I had him at at between 5-15% probability of winning. At that time, he was both polling better, and there was more time between March and the election for him to improve.

Using this approach, a Biden victory is currently standing at between a 5 and 6 sigma event. To put it into context, last years historic rate of ice-melting in the arctic was also a five sigma event.
Bonus figure:
The distribution of Presidential polling for sitting presidents who did not win re-election:

New Nate Silver predictions are out as of today. Figures reproduced here for those who lack access (all using data provided by Nate Silver)
So I'm going to try and stay true to Nate's blog-post, but I see his predictions as too important to be pay-walled (especially consider how 538 basically isn't 538 any more since they don't use Nate's model). All of the figures in this post are my own and made using Nate's data and were made in R using ggplot. Just simple reproductions for the purposes of discussion. I didn't do all of them, just the big headline figures.
If you are in Dark Mode (as you should be) you may have to right click the figures and look at them in a separate tab.
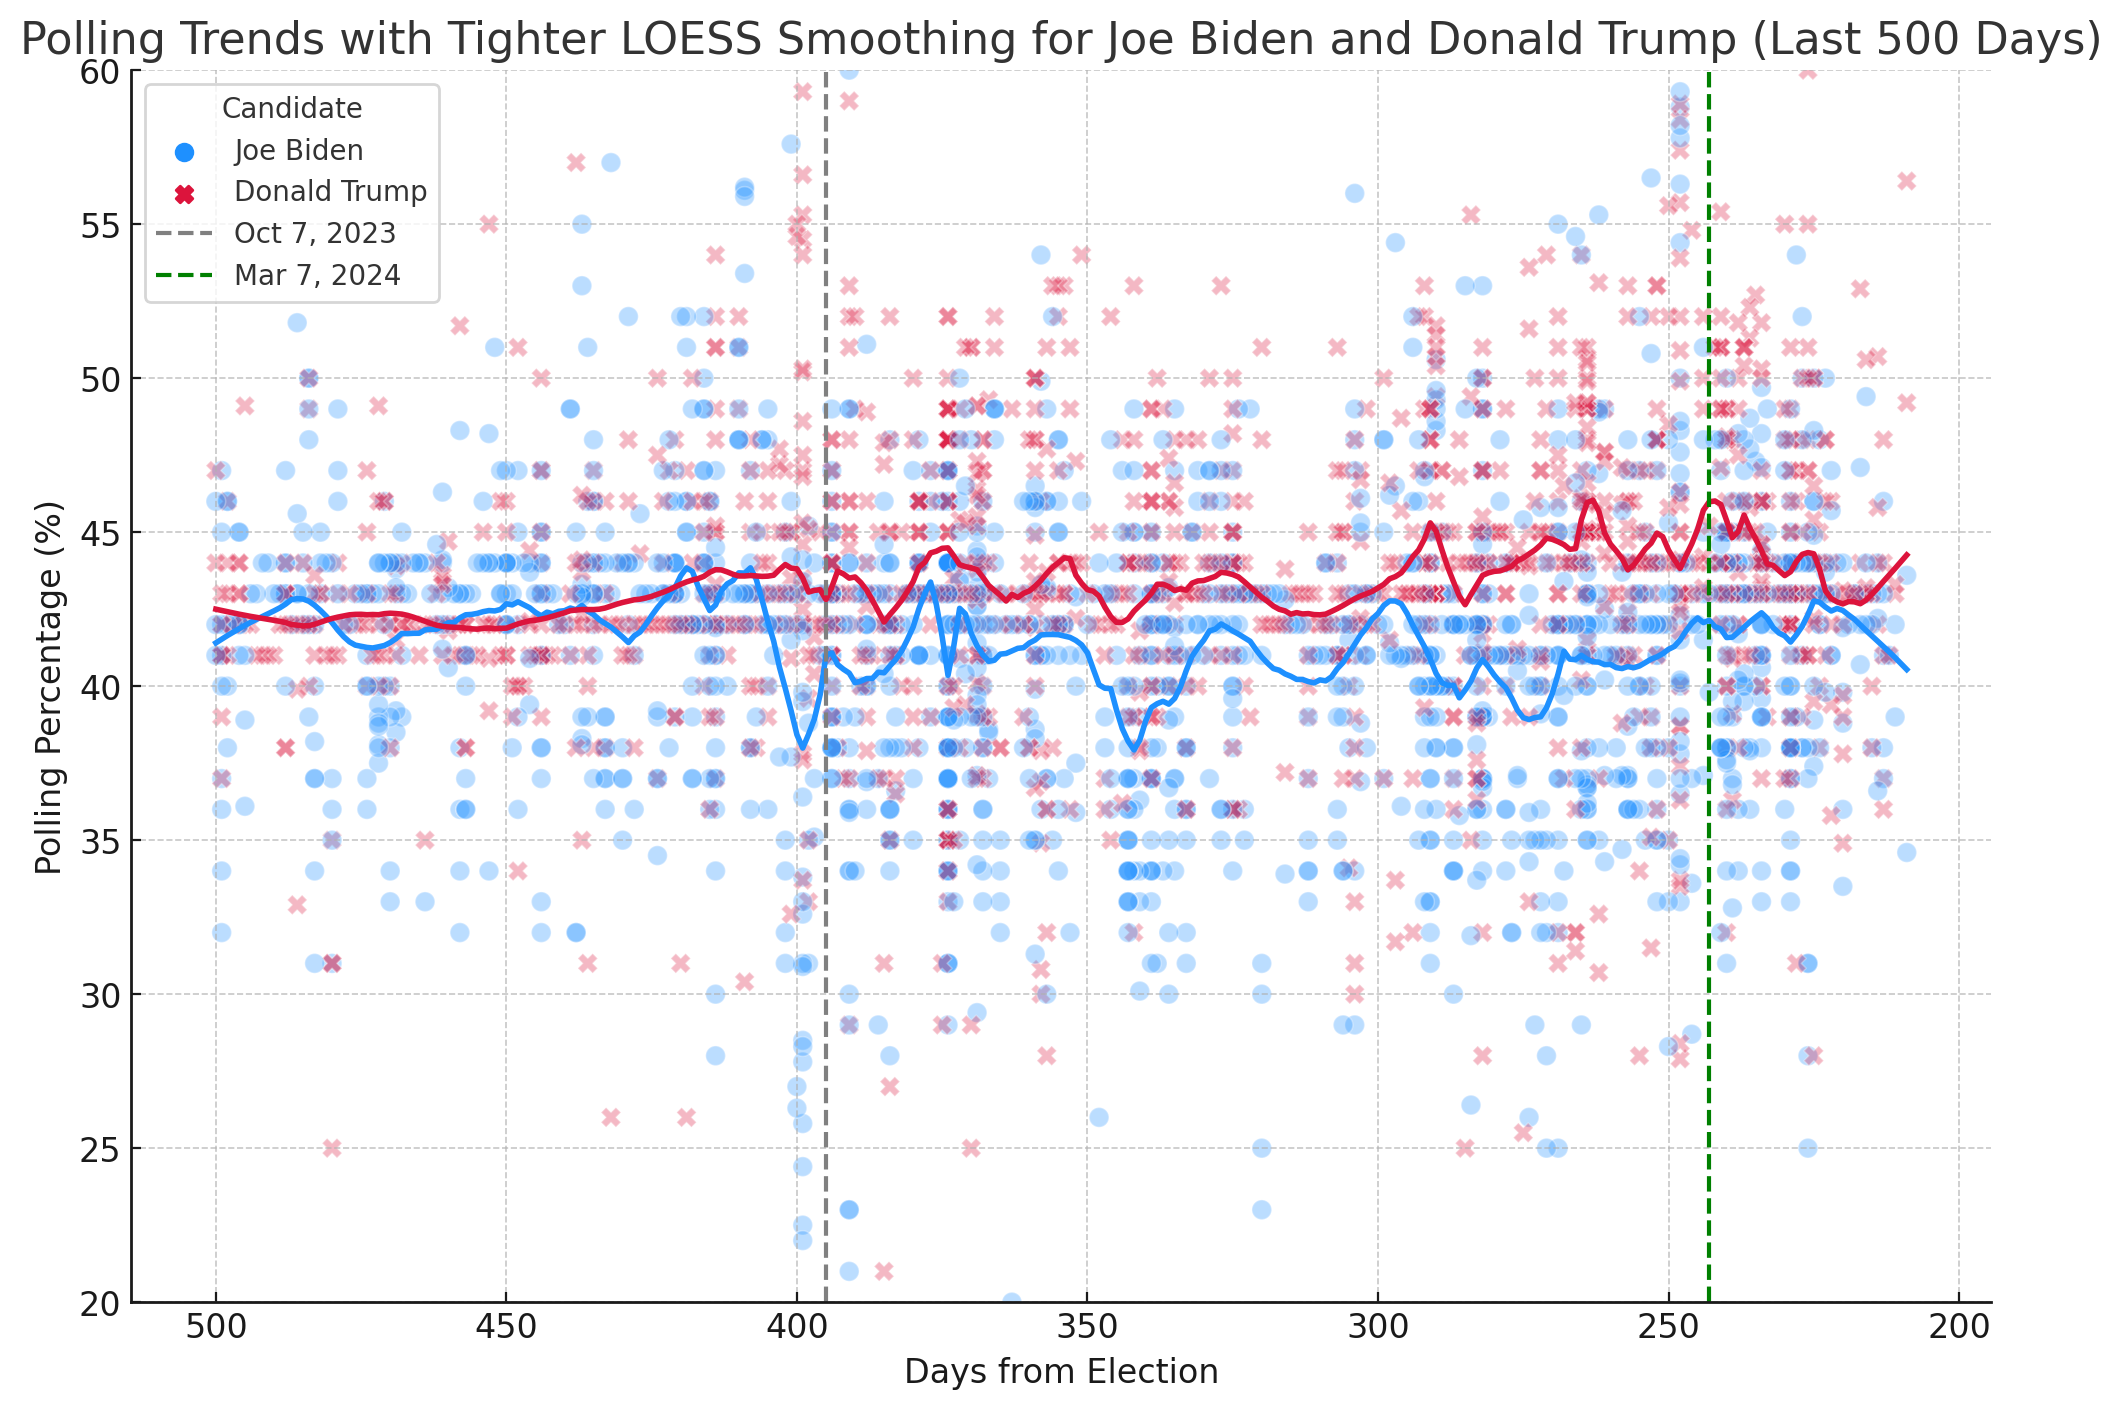
Figure 1: Who is ahead in the polls.

Figure 2: Who is ahead in the polls (inset to recent weeks).

Table 1: State and national polling.

Table 2: Who is favored to win the Presidency?

Figure 3: How each candidate's chance of wining has changed.

Figure 4: Probability of Winning Presidential Election.

Keeping everything editorial out of the post. These are basic reproductions of Nate Silvers recent post using data he provided, to support having a discussion.
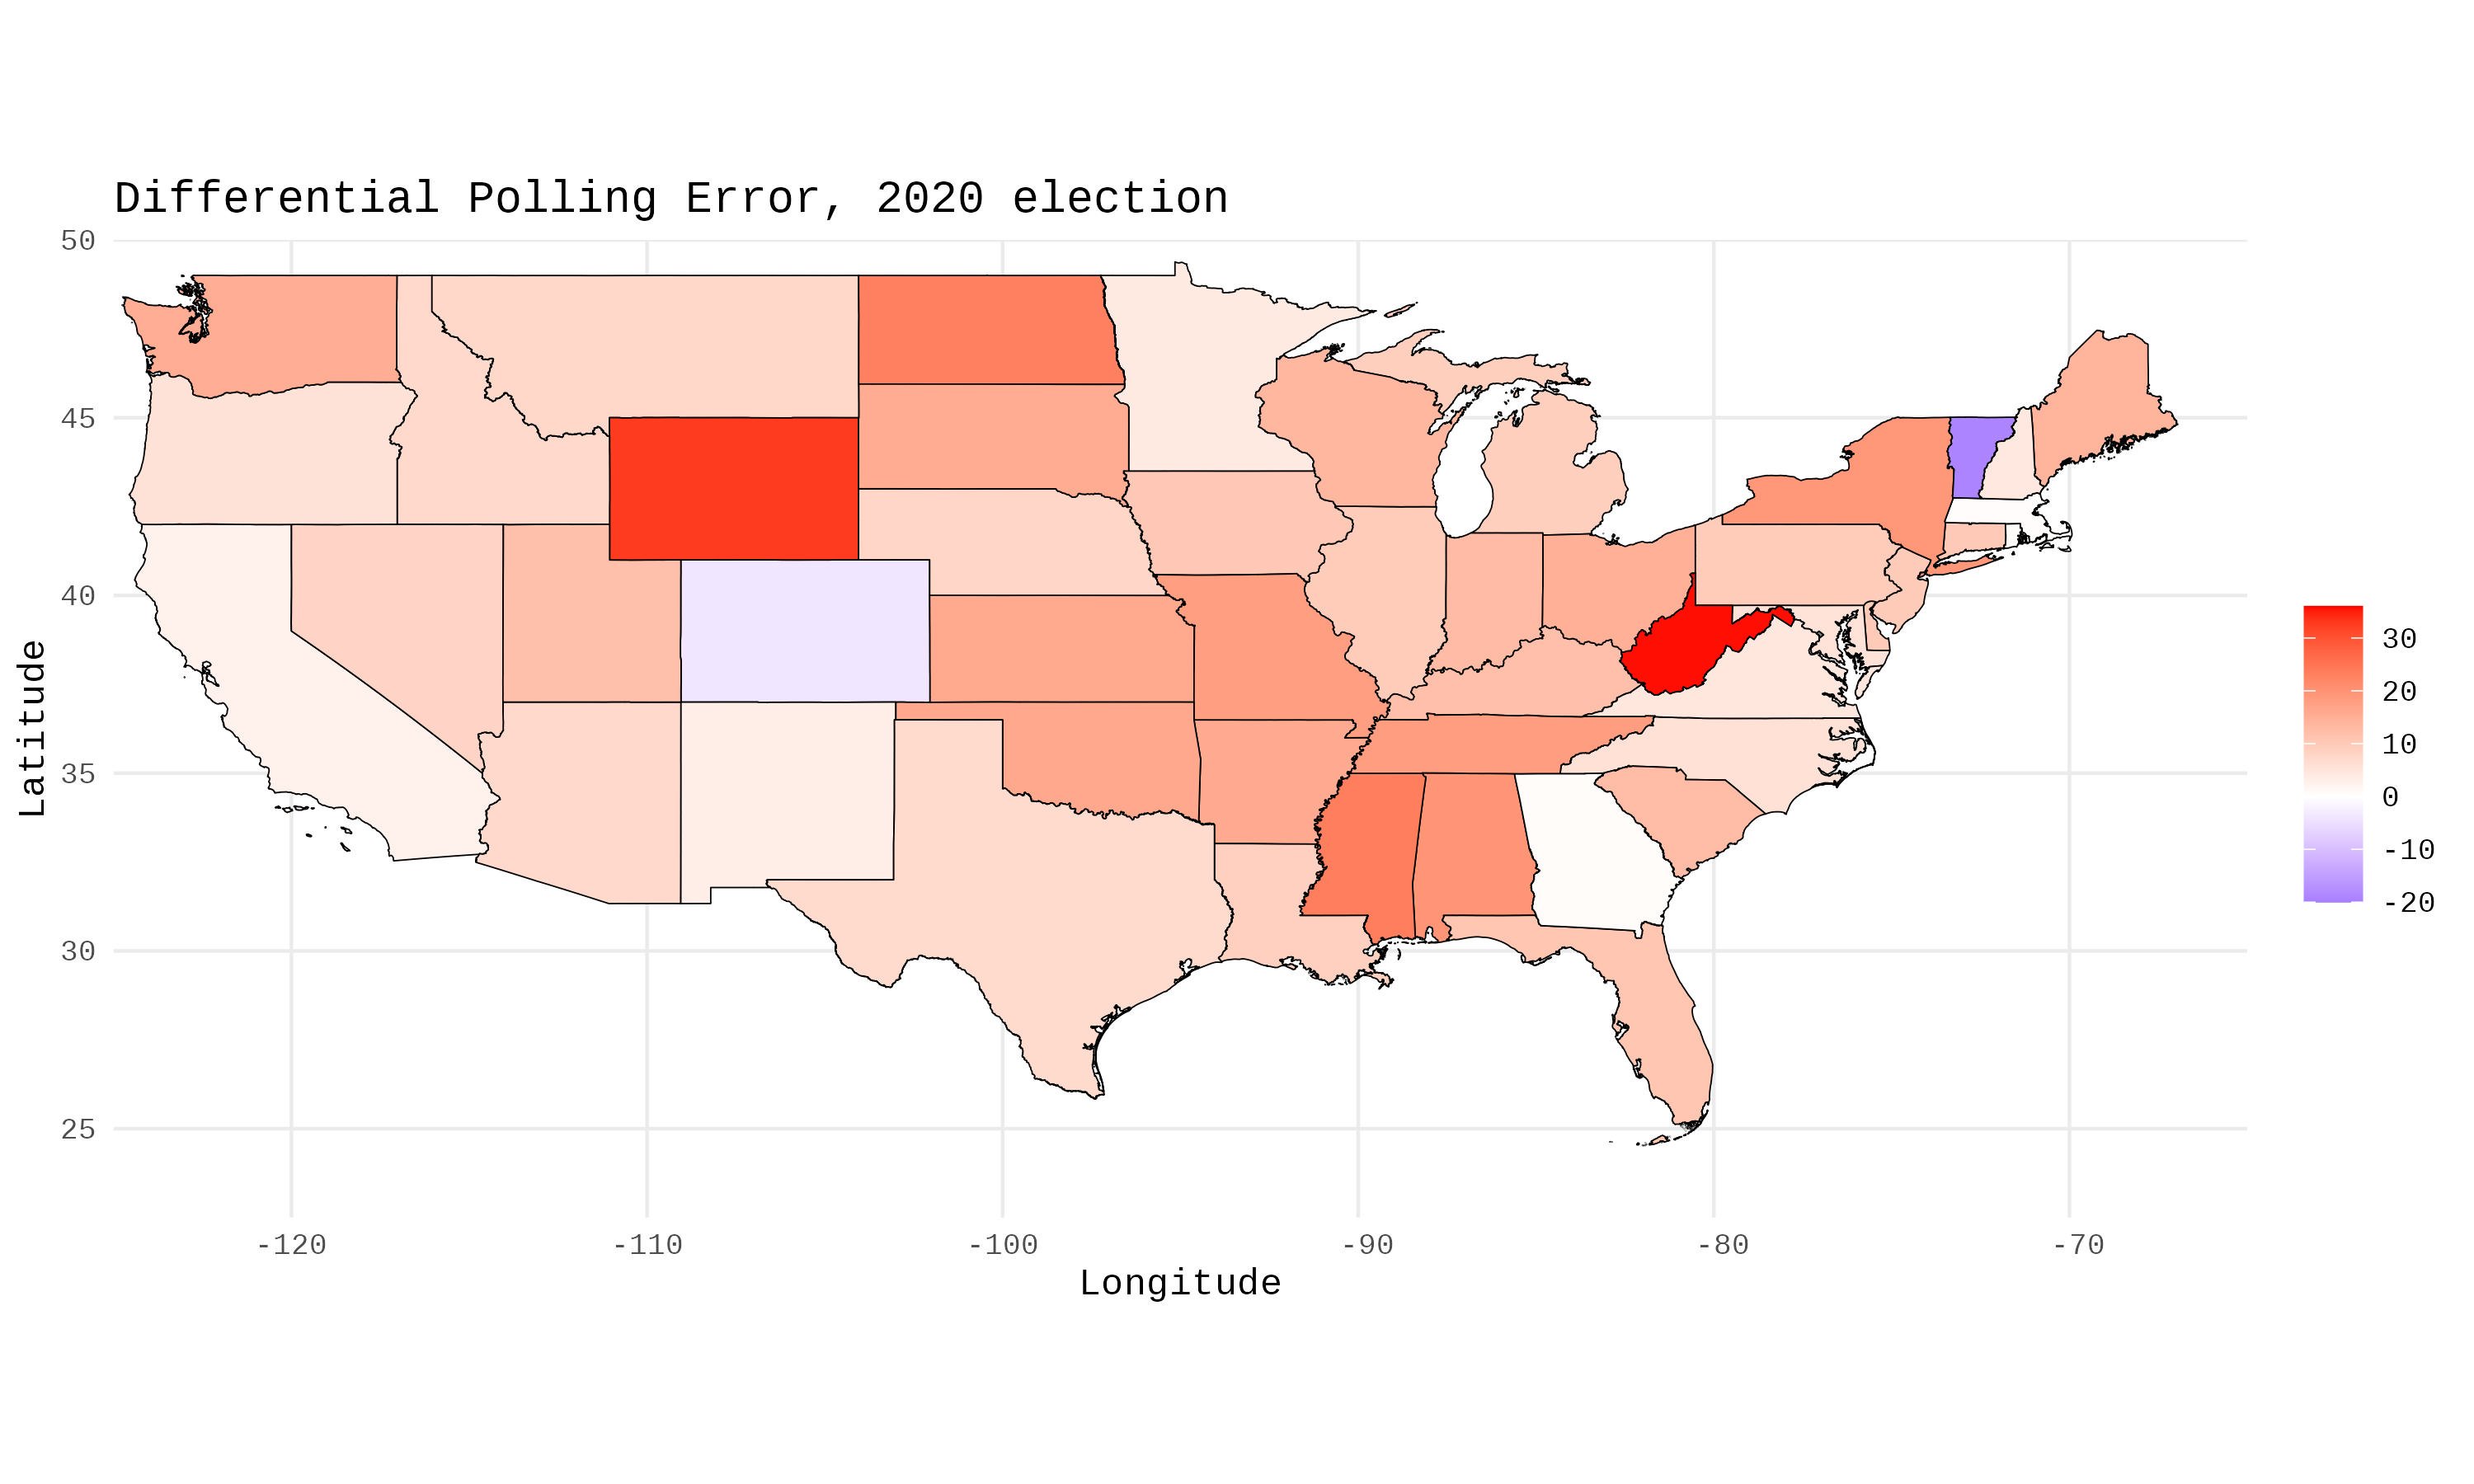
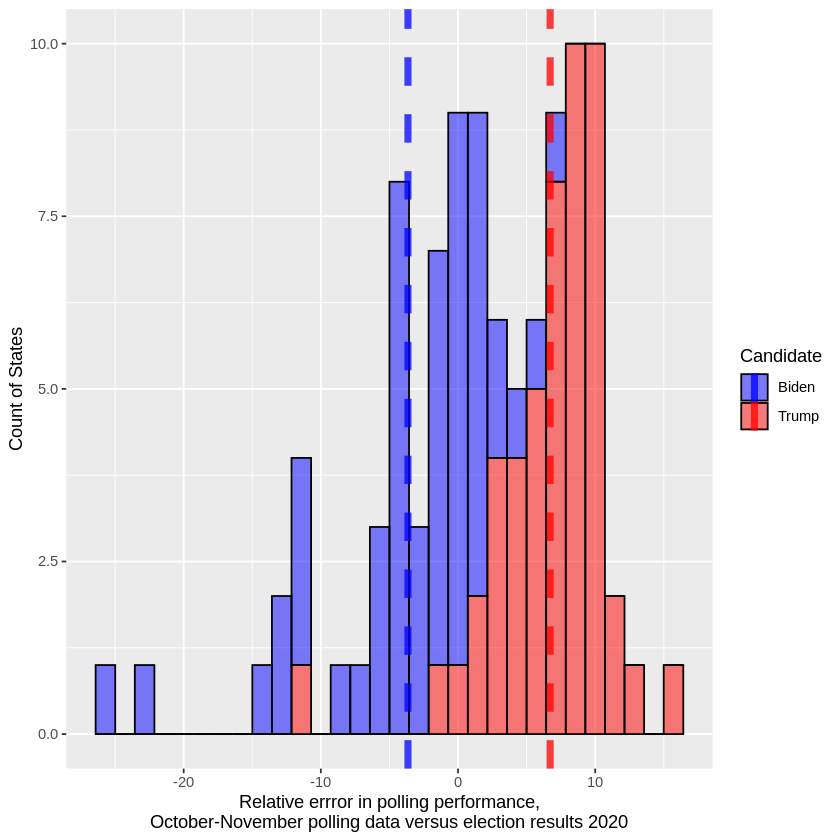
Relative error in polling performance, 2020 election cycle