Show me the math already!
A hypergeometric distribution is the statistical tool of choice this time. The first card you draw is always simple: if you have 40 lands and 99 cards the chance of drawing a land is 40/99. But what about after that? If you didn't draw a land the probability is 40/98 but if you did it's 39/98. How does that work? Hypergeometric distributions (Wikipedia article) describe this behaviour nicely when you've got a single variable. You need the following information: total number of cards, cards drawn, number of desired cards in the deck, and number of desired cards in the hand. Here's a tool you can use: the Aetherhub tool. The formula spits out a probability of the desired event happening, where "event" means for example "you drawing 3 lands in your opening 7 when you've got a deck of 99 cards with 40 lands in it".
There's a problem, though. What if we have lands and ramp we want to consider? Introducing multivariate hypergeometric distributions. A powerful tool that can have any number of variables. For example we could consider the probability of "you drawing 3 lands and 1 ramp spell and 1 draw spell in your opening 7 when you've got a deck of 99 cards with 40 lands in it". Multivariate hypergeometric distribution is what we're going to use. We've got two variables in this study: number of lands and number of ramp. We assume that the third category is "other spells" and none of these categories overlap (they're mutually exclusive). This puts things like [[Ancient Tomb]] in a weird spot because it belongs in two different categories simultaneously but we'll just blatantly ignore it.
Calculating the probability of a good hand
We take P(2 lands, 1 ramp), P(2 lands, 2 ramp), P(3 lands, 0 ramp), and P(3 lands, 1 ramp) and we add those together to get P(good hand).
The way each calculation takes place is somewhat straightforward. In mathematics there is a concept called "combination" (Wikipedia article) which is what we're going to use since most programs don't understand multivariate hypergeometric distributions. It's written generally as "n choose k" where n is the total population of the item in question and k is the number of items in a subset. The number that is spat out is the number of combinations there can be. For example 3 choose 2 would be 3 because there are 3 different combinations of two numbers that can be represented with three numbers. Imagine an apple, an orange, and a pear. You can have an apple and an orange, an apple and a pear, or an orange and a pear - three combinations. Spreadsheet programs know combinatiorials by the function name "COMBIN(n,k)".
The formula for a multivariate hypergeometric distribution is the following: (lands choose desired number of lands in hand) x (ramp choose desired number of ramp in hand) x (the others choose desired number of other cards in hand) and the whole thing is divided by all the possible starting hands in EDH which is 99 choose 7. (Which is, by the way, a pretty big number.) The resulting number is the probability of drawing such a hand.
Mulligans
Mulliganing in this case is easy. It's a bit of math but bear with me.
For the first hand it's just P(1st hand is good).
For the first mulligan since we're after the total chance we'll have P(1st is good) or P(1st is bad and 2nd is good) which is the same as P(1st is good) + P(1st is bad) x P(2nd is good).
Via complement this is the same as (1 - P(1st is bad)) + P(1st is bad) x (1 - P(2nd is bad)) which is the same as 1 - P(1st is bad) + P(1st is bad) - P(1st is bad) x P(2nd is bad).
Since between mulligans we always shuffle the deck these events are not dependent on each other i.e. they're independent. They're the same thing. Thus P(2nd is bad) is actually also P(1st is bad). At this point we're at 1 - P(1st is bad) + P(1st is bad) - P(1st is bad)^2.
This all nicely cancels itself out to the form 1 - P(1st is bad)^2 where "2" is actually the number of hands we've seen thus far. For the second mulligan it's 1 - (1st is bad)^3 and so forth.
Opening hand breakdown
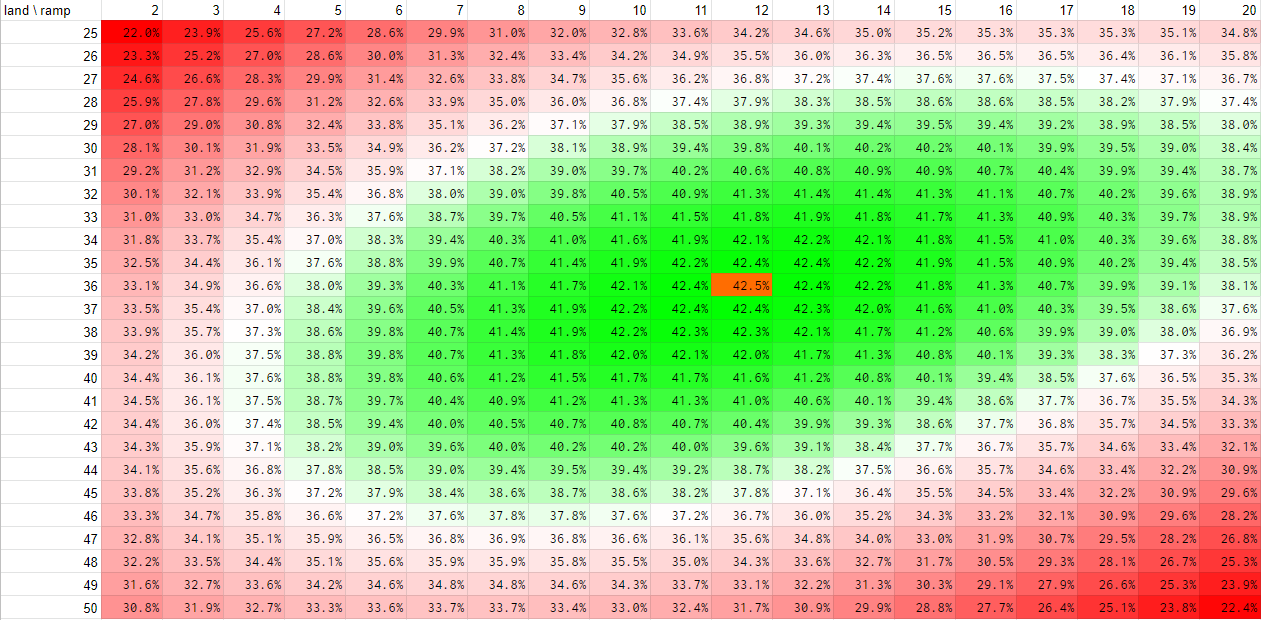
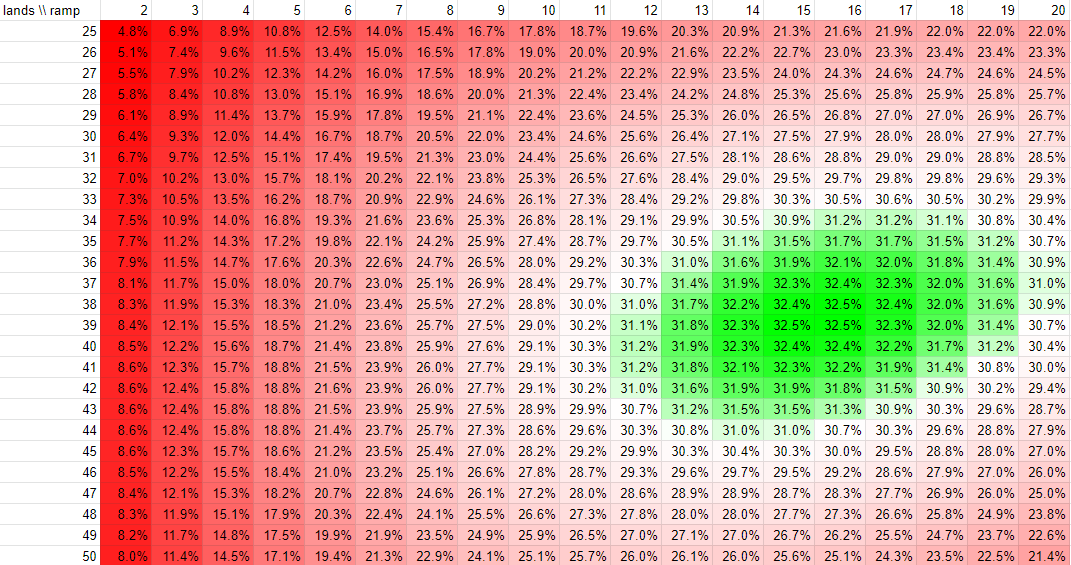
Here are the coveted charts - the first one is for the case of no mulligans and the second one is with three mulligans.
On the chart you see a heat map. The leftmost column represents the number of lands and the topmost row represents the number of ramp spells. The percentages you see in the middle are the chance of you succeeding in drawing a good hand as outlined earlier.
Each probability you see on the first heat map is for just the opening hand. Each probability you see on the second heat map is for three mulligans, i.e. down to 5 cards. It's an arbitrary number but as you can see from the percentages it's pretty rare that we'd have to mulligan any further. Plus keeping a 4 card hand is not very lucrative because you need some lands and ramp but you don't really have any space for gas. You can also go ahead and keep a mana rich hand (e.g. a 4 land hand) and bottom some mana sources you don't need in the later mulligans so that increases your chances of finding a keepable hand significantly.
You can read the charts in many ways. The most obvious takeaway is the "optimal" composition at 36 lands and 12 ramp spells because the percentage of drawing into a successful hand is the highest at that point. Isn't that what people usually recommend?
One can also use it in two other ways: given that you have an X amount of lands or ramp how many of the other type should one run for the best results? The third way is to decide on a percentage you're willing to get screwed over and look up compositions that have the same number.

